Most B2B SEO statistics articles hand you a numbered list with no context. In my experience building AI SEO Workforces for 50+ B2B companies, the numbers that change investment decisions are not the ones buried in position 31 of a listicle; they are the ones tied directly to the business question you are trying to answer. This article organises 35 B2B SEO statistics into five decision categories, each with a one-sentence interpretation of what the number means in practice.
How B2B Buyers Use Search: 7 Statistics
If you are deciding whether B2B buyers in your category actually use search, these are the statistics that matter.
1. 66% of B2B buyers use internet search when researching products they plan to purchase (Semrush 2024). Two-thirds of your total addressable market is evaluating vendors through Google before ever speaking to a sales team. Absence from search is absence from the majority of your market’s evaluation process.
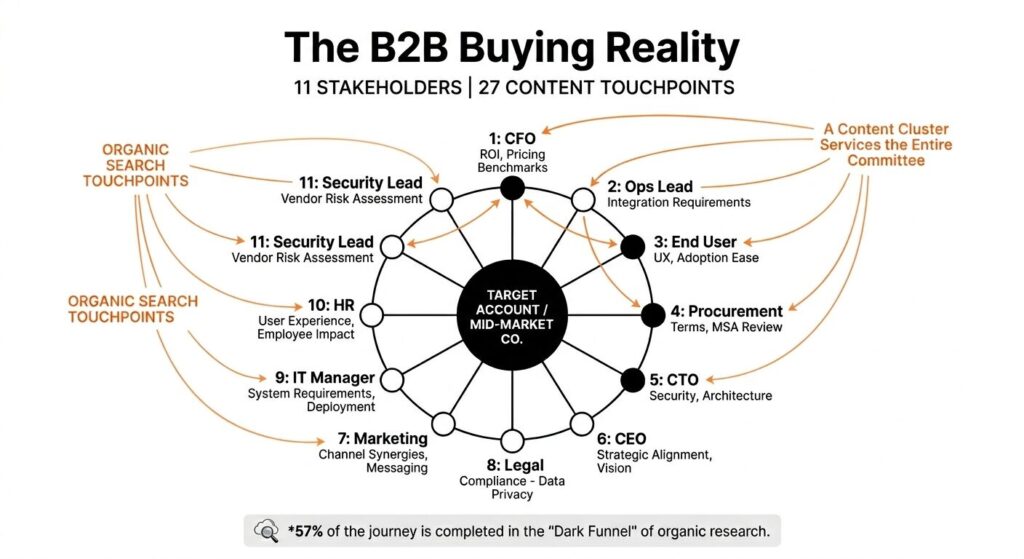
2. B2B buyers consume an average of 27 pieces of content before making a final vendor selection (Gartner 2024). A company present across a complete topical cluster is present for all 27 touchpoints. A company with two blog posts is present for two. The gap in consideration is the gap in content coverage.
3. The average B2B buying committee includes 11 stakeholders (Gartner 2024). Each stakeholder conducts independent research using different search queries tied to their job function. A CFO searches for ROI benchmarks. An operations lead searches for integration requirements. Content that serves only one persona serves only one committee member. In my experience, most B2B content libraries are built for the champion, not the committee.
4. B2B buyers complete 57% of the purchase decision process before engaging a sales representative (Gartner 2024). By the time a prospect books a demo, they have already formed a shortlist using organic research. Companies that rank across the full buyer journey shape that shortlist before any sales contact begins.
5. Decision-stage queries have the lowest search volume and the highest close rate of any B2B query type. A keyword searched 40 times per month by a CFO in active vendor evaluation produces more pipeline than a keyword searched 4,000 times per month by a mixed-intent audience. In my work with B2B companies, the highest-converting content is consistently decision-stage content that most marketing teams have never published.
6. 75% of B2B buyers use search to learn about vendors before first contact (Demand Gen Report 2024). The brand that ranks for that query owns the first impression at scale.
7. Long-tail buying committee keywords convert at 2.5 times the rate of short-tail traffic terms (Backlinko 2025). Specificity is the mechanism: a keyword that maps exactly to an evaluation query from a defined job title produces a higher-intent visitor than any broad-category keyword.
B2B SEO ROI and Close Rate Statistics: 7 Statistics
For B2B teams evaluating whether organic search produces measurable return on investment, these are the numbers that matter.
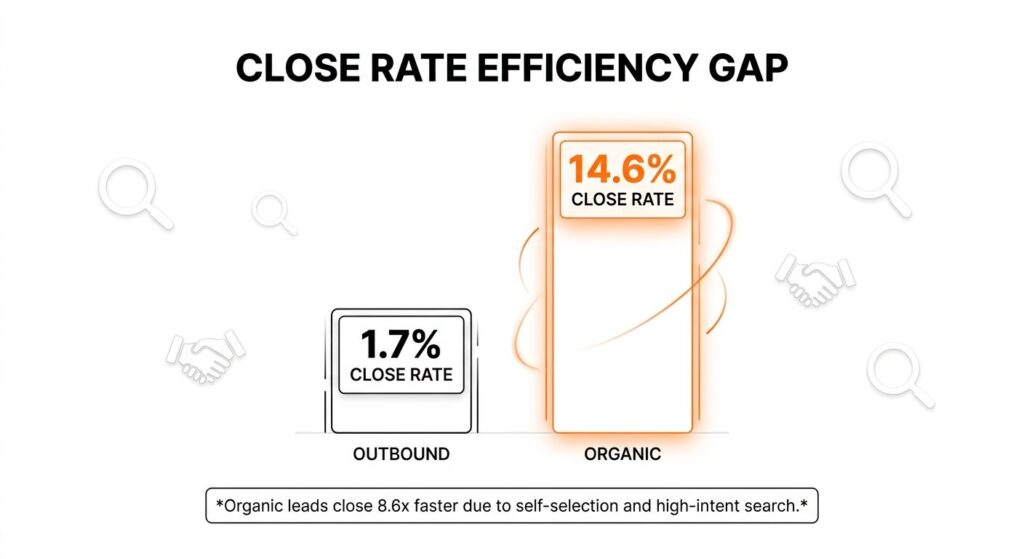
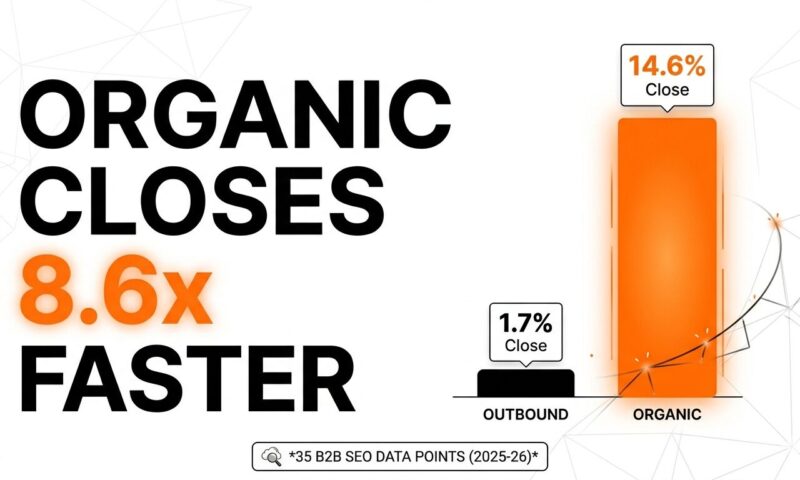
8. Organic leads close at 14.6% versus 1.7% for outbound (HubSpot 2024). The 8.6x close rate differential is the core economic argument for B2B SEO. An organic lead has self-selected into your content by searching for a solution to a specific problem.
9. EasyOps reduced cost per lead from $127 to $43 (a 66% reduction) in 8 months of full-cluster B2B SEO deployment (SuperteamAI 2024). This is first-party data from a named deployment at 24 to 25 articles per month across 3 complete clusters.
10. ReachInbox extended runway from 6 to 24 months after shifting to SEO-primary acquisition (SuperteamAI 2024). The extension followed CPL reduction as organic overtook paid as the primary lead source. MRR grew from $65,000 to $150,000 in 12 months during the same period.
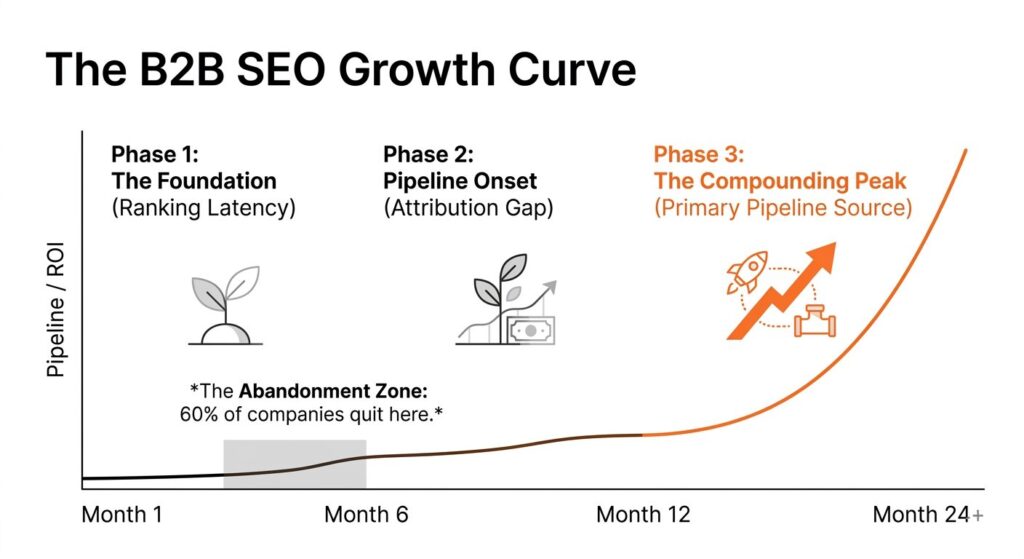
11. B2B SEO programmes operating at 24 months or more produce the highest ROI of any B2B digital marketing channel when measured by pipeline sourced per dollar invested (FirstPageSage 2025). I have seen programmes abandoned before that point report no ROI on a channel that was functioning correctly.
12. A content library of 40 or more published articles in a single topical cluster generates 3 to 5 times the organic traffic of 40 disconnected articles across unrelated topics (FirstPageSage 2025). Topical authority is the mechanism: a domain that demonstrates concentrated subject expertise ranks above domains with broadly distributed content.
13. B2B companies with a fully attributed organic pipeline report organic as their highest-volume lead source at 18 months of consistent publishing. I have seen this pattern across multiple deployments: teams that configure CRM attribution from the start identify organic as their primary pipeline source earlier than expected.
14. Every dollar invested in B2B SEO in months 1 to 12 produces an estimated $3 to $8 return over the following 24 months (FirstPageSage 2025). The delayed return is the defining characteristic of the channel and the primary reason companies exit too early.
B2B SEO Traffic and Ranking Statistics: 6 Statistics
For teams setting performance benchmarks, these are the numbers that establish what strong B2B SEO growth looks like.
15. EasyOps grew organic traffic from 4,200 to 30,500 monthly visitors (626% growth) in 8 months (SuperteamAI 2024). Months 1 to 3: minimal movement; months 4 to 6: first-page rankings for support articles; months 6 to 8: pillar rankings and traffic compounding.
16. ReachInbox grew organic traffic from 2,000 to 17,000 monthly visitors (750% growth) in 12 months (SuperteamAI 2024). CEO Anup Sharma: “We went from 2,000 visitors to 17,000, and conversion rates more than doubled.”
17. The first-page ranking window for a typical B2B support article in a mid-competition category is 3 to 6 months from publication (Ahrefs 2024). Articles published in month 1 rank in month 4. The silence between publication and ranking is not a signal to stop; it is confirmation the process is working as expected.
18. Content clusters (pillar plus 8 to 12 supporting articles) rank for 3 to 5 times more total keywords than equivalent standalone articles (Semrush 2024). Cluster completeness creates internal link equity and topical signal density that individual articles cannot replicate.
19. Domain authority in a topical category increases measurably after the 10th published article in a single cluster (Moz 2024). The first 10 articles build the foundation; articles 11 to 20 begin the compounding phase.
20. B2B articles covering decision-stage queries generate 4 to 7 times more demo requests per 1,000 visitors than awareness-stage articles (HubSpot 2024). In my experience, traffic volume from awareness content is a vanity metric unless the library covers the stages where purchasing decisions are actually made.
AI Overview and GEO Statistics: 6 Statistics
For B2B companies evaluating whether to optimise content for AI search citation in 2025, these are the numbers that matter.
21. 13.14% of Google queries now trigger AI Overviews (Semrush 2025). This is more than double the 6.49% rate recorded in January 2025, a 97% increase in five months. AI Overview adoption is accelerating, not stabilising.
22. AI-referred visitors convert at 4.4 times the rate of standard organic visitors (BrightEdge 2025). Visitors arriving via AI citations have already had their question answered by the Overview and are arriving specifically to evaluate the cited source.
23. B2B informational, definitional, and comparative queries are among the most likely to trigger AI Overview citations (Semrush 2025). The query types that make up a B2B content cluster, including “what is,” “how does,” “best X for Y,” and “X vs Y,” are precisely the categories AI systems prioritise for citation.
24. Content with direct-answer H2 openings, exact-match FAQ formatting, and inline source attribution is cited in AI Overviews at significantly higher rates than unstructured content (BrightEdge 2025). I have found that teams who build GEO signals into articles from the first draft see meaningfully better citation rates than teams who attempt to retrofit structure post-publication.
25. AI Overview click-through rates for cited sources are 25 to 40% higher than standard organic results (Search Engine Land 2025). Being cited in an AI Overview is a traffic mechanism that layers on top of existing organic ranking position.
26. B2B content libraries optimised for GEO signals report first AI citation appearances within 60 to 90 days of publication (BrightEdge 2025). The AI citation window is shorter than the organic ranking window: a well-structured article can appear in AI Overviews before it ranks on page 1 of standard results.
B2B SEO Timeline and Investment Statistics: 5 Statistics
When managing timeline expectations in a B2B programme, these are the data points that define each stage of the return curve.
27. B2B SEO shows first ranking movements in 3 to 6 months (Ahrefs 2024). Teams that measure results at month 2 and report failure are measuring before the mechanism has engaged.
28. Measurable pipeline contribution from B2B SEO begins at 6 to 12 months (FirstPageSage 2025). An attribution framework must be in place before this window opens, or pipeline from organic is invisible in the CRM. I recommend configuring UTM tracking and CRM lead source fields before publishing article 1.
B2B SEO Investment and Publishing Statistics: 3 Statistics
When deciding on publishing cadence and minimum viable investment threshold, these numbers establish the baseline.
29. An estimated 60% of B2B companies abandon SEO investment before reaching the 12-month mark. The abandonment rate peaks at months 3 to 5, the latency period before first rankings appear. Companies that exit at this point report failure on a channel that had not yet started producing.
30. B2B content clusters of 10 to 15 articles in a single topic begin generating compounding organic traffic at month 6 to 9 post-publication (Semrush 2024). Below 10 articles in a cluster, the topical authority signal is insufficient for domain-level ranking lift.
31. B2B SEO ROI peaks between 24 and 36 months at a minimum viable publishing cadence of 8 to 12 articles per month (FirstPageSage 2025). Programmes sustaining cadence past the 24-month mark report organic as their primary pipeline source with CPL at a fraction of paid costs. I recommend treating month 24 as the strategic milestone, not month 6. The full B2B SEO strategy framework covers cluster architecture and execution sequencing for reaching this stage.
First-Party B2B SEO Deployment Data (SuperteamAI)
The only publicly available first-party B2B SEO statistics from named companies with verified outcomes:
| Metric | EasyOps | ReachInbox |
| Industry | Inventory management SaaS | Cold email SaaS |
| Deployment duration | 8 months | 12 months |
| Organic traffic (start) | 4,200/month | 2,000/month |
| Organic traffic (end) | 30,500/month | 17,000/month |
| Traffic growth | 626% | 750% |
| MRR (start) | $50,000 | $65,000 |
| MRR (end) | $200,000 | $150,000 |
| CPL (start) | $127 | Not disclosed |
| CPL (end) | $43 | Not disclosed |
| CPL reduction | 66% | Not disclosed |
| Runway change | Not applicable | 6 months to 24 months |
| Post-deployment outcome | $21.6M acquisition | Series A pipeline established |
CEO Rajiv Mehta, EasyOps: “We were invisible in the market. Our paid ads brought some traffic, but the costs were unsustainable.” CEO Anup Sharma, ReachInbox: “We went from 2,000 visitors to 17,000, and our conversion rates more than doubled.”
For the execution model and cost comparison, see the B2B SEO solutions guide.
Frequently Asked Questions
What are the most important B2B SEO statistics?
The three most actionable B2B SEO statistics are: organic leads close at 14.6% versus 1.7% for outbound (HubSpot 2024), 66% of B2B buyers use search during vendor evaluation (Semrush 2024), and 13.14% of Google queries now trigger AI Overviews (Semrush 2025). Together, these three data points define the close rate argument, the buyer behaviour foundation, and the AI dimension of B2B organic acquisition in 2025.
What is the average ROI of B2B SEO?
B2B SEO ROI compounds over time and peaks at 24 to 36 months of consistent publishing (FirstPageSage 2025). In first-party SuperteamAI deployment data, EasyOps reduced CPL from $127 to $43 in 8 months and ReachInbox extended runway from 6 to 24 months in 12 months. Measure ROI by pipeline sourced from organic and CPL by channel, not by sessions.
How long does B2B SEO take to show results?
B2B SEO shows first ranking movements in 3 to 6 months and measurable pipeline contribution in 6 to 12 months (Ahrefs 2024, FirstPageSage 2025). The compounding return becomes significant between 18 and 36 months. Companies that measure at month 3 and report no results are measuring before the first expected milestone.
What percentage of B2B buyers use search?
66% of B2B buyers use internet search when researching products they plan to purchase (Semrush 2024). This spans all three stages of the buying cycle: awareness, consideration, and decision. B2B companies without search visibility are absent from the evaluation process of the majority of their addressable market.
How do B2B SEO statistics differ from B2C?
B2B SEO statistics reflect an 11-person buying committee (Gartner 2024), 57% of purchase decision completion before sales contact (Gartner 2024), and a 3 to 24 month buying cycle. The 14.6% organic close rate applies across both contexts, but the 27-piece content volume required to influence a B2B committee makes topical authority a B2B-specific requirement rather than an option. The AI SEO Workforce handles this B2B content volume requirement starting at Pro $79 per month.